Understanding xG: The Metric That Changed Football
The Flaw of the Scoreline
In football, the better team doesn't always win. A team can have 30 shots and 70% possession but lose 1-0 because of a lucky deflection. This "randomness" is what makes football beautiful, but it's a nightmare for analysts who want to know if a team is actually playing well.
To solve this, we use Expected Goals (xG).
xG doesn't tell us what did happen; it tells us what should have happened based on the quality of the chances created.
How is xG Calculated?
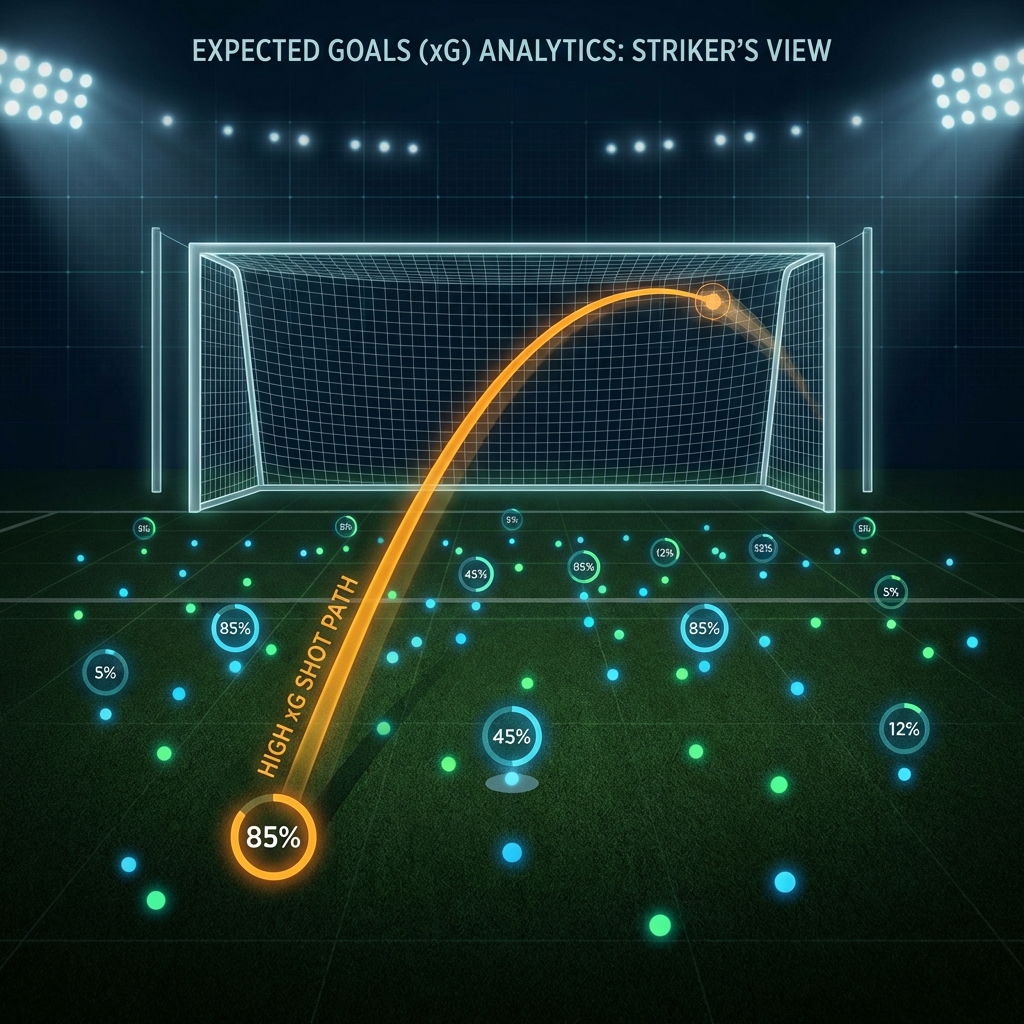
Every shot taken in a professional match is assigned a value between 0.00 and 1.00.
- 0.10 xG means that historically, a shot taken from that exact position and situation resulted in a goal 10% of the time (1 in 10).
- 0.80 xG means the shot results in a goal 80% of the time (4 out of 5)—this is typically the value assigned to a penalty.
To calculate this, data providers like Opta and StatsBomb analyze over 300,000 historical shots based on several key variables:
- Distance to Goal: The closer you are, the higher the xG.
- Angle to Goal: A shot from directly in front is worth more than a shot from a tight angle.
- Type of Assist: A cross is harder to score from than a through-ball.
- Body Part: Is the shot taken with the foot or the head? (Feet are statistically more accurate).
- Defensive Pressure: Are there three defenders in front of the ball, or is it an open goal?
Why Should You Care About xG?
1. Identifying "Lucky" Teams
If a team is winning matches but their xG is consistently lower than their opponents, it suggests they are being "lucky" (or have a world-class goalkeeper). Historically, these teams eventually see their results drop down to match their xG.
2. Evaluating Strikers
If a striker has 20 goals but only 12 xG, it means they are an elite finisher who can score from difficult situations. If they have 5 goals from 15 xG, it suggests they are finding the right positions but are struggling with their finishing.
3. Measuring Managerial Tactics
xG allows us to see if a manager's system is working. A coach who says, "We created enough to win," can be proven right or wrong by the xG data. It's the ultimate tool for objective analysis.
The Limitation of xG
xG is not a perfect crystal ball. It doesn't take into account the "skill of the individual." It assumes an "average" player is taking the shot. When Lionel Messi takes a shot from 20 yards, his chance of scoring is much higher than a defender's chance from the same spot, even though the xG value remains the same.
Additionally, xG doesn't measure "dangerous moments" where no shot was taken (like a cross that narrowly misses a striker’s head). For that, we use other metrics like Expected Threat (xT).
Conclusion
Expected Goals has moved football from a game of "gut feelings" to a game of "informed analysis." It allows fans to see through the "lying" nature of a single scoreline and understand the underlying quality of a team. Whether you are a fantasy football manager or a casual fan, understanding xG is the first step toward seeing the game like a professional analyst.
Share this guide
Use Data to Win
Now that you understand the stats, see them in action. Check out the best defensive teams in Europe right now.
View Defensive Stats